Types of aerators, fuels and electric motorsGlobally, most farmed shrimp is produced in mechanically\r\naerated, outdoor ponds.Mechanical aeration is a major component of energy use in\r\nshrimp farmi...
Types of aerators, fuels and electric motors
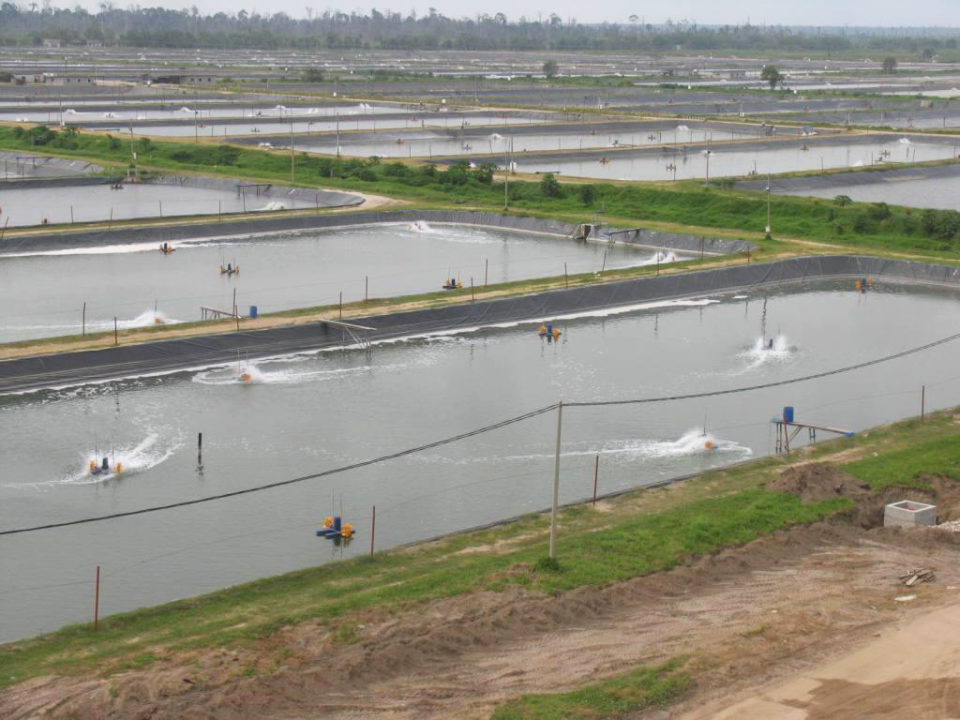
Globally, most farmed shrimp is produced in mechanically\r\naerated, outdoor ponds.
Mechanical aeration is a major component of energy use in\r\nshrimp farming. Around 4 million metric tons (MT) of the roughly 5 million MT\r\nof farm-reared penaeid shrimp in 2016 were from mechanically aerated ponds. The\r\namount of aeration used in shrimp ponds has not been carefully studied, but\r\nshrimp farm managers often use a “rule of thumb” that each 300- to 500-kg\r\nincrement of shrimp production requires 1 hp of aeration (3.33 to 2.0 hp/MT\r\nshrimp). Up to 1.5 MT/ha of shrimp can be produced without aeration, but this\r\nquantity usually is not subtracted from the production goal in calculating the aeration\r\nrate in order to allow a safety factor.
Determination of aeration rate from practical experience is\r\nnot exact, but the complexity of dissolved oxygen budgets in aquaculture ponds\r\nmakes it impossible to accurately calculate the aeration rate using equations\r\nbased on hourly oxygen demand of the water, aerator oxygen transfer efficiency,\r\nminimum acceptable dissolved oxygen concentration, and water quality\r\ncharacteristics as done for wastewater treatment basins. Practical experience\r\nand monitoring of dissolved oxygen concentration remains the common ways of\r\ndeciding how much aerator horsepower to install in ponds and for establishing\r\nschedules for daily aerator operation.
Small, electric motors use about 1 kWhr (a kilowatt-hour is\r\na unit of energy equal to 3.6 megajoules) electricity per horsepower-hour of\r\noperation. The amount of energy used per MT of shrimp at an aeration rate of\r\n2.5 hp/MT shrimp with aerators operated in ponds for an average of 16 hours a\r\nday during an 80-day grow-out period is quite large. Amounts of electricity\r\n(and energy) per hectare will increase steadily as production goal in MT per\r\nhectare increases, but the amount of energy applied per MT of shrimp for\r\naeration is 11.5 GJ/MT (2.5 kW/MT ×16 hours/day × 80 days/crop × 0.0036\r\nGJ/kWhr; GJ = gigajoule, a unit of measurement of energy) and constant across\r\nall production intensities.
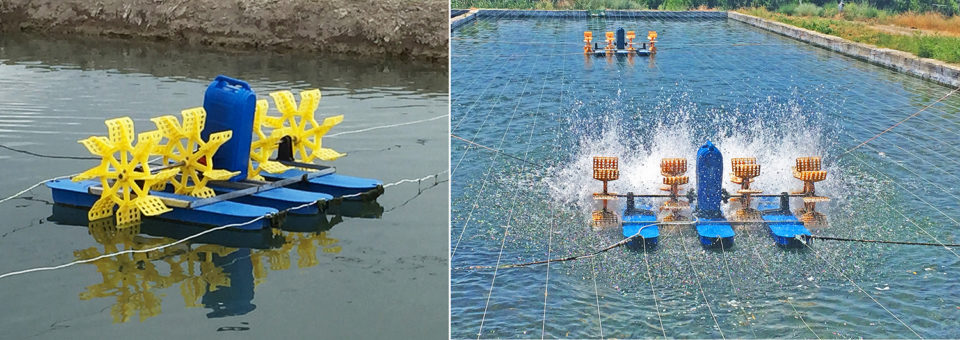
An Asia-style, small, electric, floating paddlewheel\r\naerator.
There are several types of aerators; different methods of\r\npowering aerators; and energy efficiencies of motors, engines and drive trains\r\ndiffer. The experience-based rule for aerator rate mentioned above was\r\ndeveloped years ago in Asia for small 1- or 2-hp floating, electric paddlewheel\r\naerators (image 1 below) that were widely used in shrimp ponds and for 1- to\r\n2-hp propeller-aspirator-pump aerators (image 2 below) that also have received\r\nappreciable use in shrimp farming. Over the years, shrimp farmers have learned\r\nto fabricate and use less expensive, but also less efficient versions of\r\nfactory-manufactured aerators. A discussion of the factors influencing the\r\nefficiency of energy use in shrimp pond aeration is overdue.
Aerators often are powered by electricity supplied by\r\nnational or regional grids. Electric generators, usually powered by diesel\r\nengines located onsite, may also provide electricity for aeration. Fuels differ\r\nin energy content (Table 1) and energy also is used to produce these fuels. The\r\ntotal energy use incurred for fuel is its energy content plus the amount of\r\nenergy required for its production (embodied energy). Total energy use may be\r\nestimated by multiplying the amount of each fuel used by the embodied energy\r\nfactor for that fuel (Table 1).
Boyd, aeration Pt. 1, Table 1
\r\n\r\n| \r\n Fuel \r\n | \r\n \r\n Energy content (1) \r\n | \r\n \r\n Embodied energy factor \r\n | \r\n
| \r\n | \r\n | \r\n |
| \r\n Ethanol (E100) \r\n | \r\n \r\n 21.27 MJ/L \r\n | \r\n \r\n 1.49 (2) \r\n | \r\n
| \r\n Ethanol (E85) \r\n | \r\n \r\n 22.58 MJ/L \r\n | \r\n \r\n 1.34 (3) \r\n | \r\n
| \r\n LPG (liquid propane gas) \r\n | \r\n \r\n 23.48 MJ/L \r\n | \r\n \r\n 1.12 (4) \r\n | \r\n
| \r\n Gasoline (no ethanol) \r\n | \r\n \r\n 31.80 MJ/L \r\n | \r\n \r\n 1.36 (4) \r\n | \r\n
| \r\n Gasoline (10% ethanol) \r\n | \r\n \r\n 31.25 MJ/L \r\n | \r\n \r\n 1.37 (3) \r\n | \r\n
| \r\n Biodiesel \r\n | \r\n \r\n 33.32 MJ/L \r\n | \r\n \r\n 1.69 (5) \r\n | \r\n
| \r\n Diesel (No. 2) \r\n | \r\n \r\n 35.80 MJ/L \r\n | \r\n \r\n 1.28 (4) \r\n | \r\n
| \r\n Electricity \r\n | \r\n \r\n 3.6 MJ/kWhr \r\n | \r\n \r\n 2.50 \r\n | \r\n
Table 1. Energy content (lower heating value) of common\r\nfuels and factors for including embodied energy in fuel energy calculations.
\r\n1: https://afdc.energy.gov/fuels/fuel comparison_chart_pdf.
\r\n2:\r\nhttp://large.stanford.edu/courses/2014/ph240/dikeou1/docs/ethanolnetenergy.pdf
\r\n3: Calculated.
\r\n4: http://www.iea.org/statistics/resources/manuals/
\r\n5: https://.adfc.energy.gov/files/pdfs/3229.pdf
\r\n
\r\n
The energy contents of fuel allow determination of the\r\nvolumes of each fuel necessary to provide the same amount of energy at a\r\nspecific motor or engine efficiency. For example, 1.68 liters of fuel-grade\r\nethanol (E100) would be required to obtain the same amount of energy provided\r\nby 1.0 liter of No. 2 diesel fuel (35.80 MJ/L diesel fuel ÷ 21.27 MJ/L ethanol\r\n= 1.68; MJ = megajoule, a unit of measurement of energy). Likewise, 9.94 kWhr\r\nof electricity represents the same amount of energy as does 1 liter of No. 2\r\ndiesel fuel.
\r\n\r\nElectricity generating plants convert primary energy in coal\r\nand other primary fuels with an efficiency of around 40 percent, and there is\r\nan additional loss of about 7 percent of the original primary energy in\r\ntransmission of electricity through the grid – overall efficiency of about 33 percent. Larger generators are more efficient than\r\nsmaller generators in converting the energy of diesel fuel to electricity (Table\r\n2), but larger units are only 35 to 38 percent efficient, and additional losses\r\nwill occur in transmission to aerator motors.
\r\n\r\nBoyd, aeration Pt. 1, Table 2
\r\n\r\n| \r\n Rated output (kW) \r\n | \r\n \r\n Fuel use at 75% load (L/hr) \r\n | \r\n \r\n Energy output at 75% load (% input) \r\n | \r\n \r\n Energy output at 75% load (kW/L) \r\n | \r\n \r\n Energy output at 75% load (MJ/L) \r\n | \r\n
| \r\n | \r\n | \r\n | \r\n | \r\n |
| \r\n 25 \r\n | \r\n \r\n 7.00 \r\n | \r\n \r\n 26.9 \r\n | \r\n \r\n 2.65 \r\n | \r\n \r\n 9.65 \r\n | \r\n
| \r\n 50 \r\n | \r\n \r\n 13.25 \r\n | \r\n \r\n 28.4 \r\n | \r\n \r\n 2.83 \r\n | \r\n \r\n 10.19 \r\n | \r\n
| \r\n 100 \r\n | \r\n \r\n 21.95 \r\n | \r\n \r\n 34.3 \r\n | \r\n \r\n 3.42 \r\n | \r\n \r\n 12.31 \r\n | \r\n
| \r\n 150 \r\n | \r\n \r\n 31.79 \r\n | \r\n \r\n 35.4 \r\n | \r\n \r\n 3.54 \r\n | \r\n \r\n 12.74 \r\n | \r\n
| \r\n 200 \r\n | \r\n \r\n 41.64 \r\n | \r\n \r\n 36.1 \r\n | \r\n \r\n 3.60 \r\n | \r\n \r\n 12.96 \r\n | \r\n
| \r\n 250 \r\n | \r\n \r\n 51.48 \r\n | \r\n \r\n 36.5 \r\n | \r\n \r\n 3.64 \r\n | \r\n \r\n 13.10 \r\n | \r\n
| \r\n 500 \r\n | \r\n \r\n 99.92 \r\n | \r\n \r\n 37.6 \r\n | \r\n \r\n 3.75 \r\n | \r\n \r\n 13.50 \r\n | \r\n
| \r\n 750 \r\n | \r\n \r\n 148.75 \r\n | \r\n \r\n 37.9 \r\n | \r\n \r\n 3.78 \r\n | \r\n \r\n 13.61 \r\n | \r\n
| \r\n 1,000 \r\n | \r\n \r\n 197.20 \r\n | \r\n \r\n 38.1 \r\n | \r\n \r\n 3.80 \r\n | \r\n \r\n 13.68 \r\n | \r\n
Table 2. Typical fuel use and energy output for different\r\nsizes of diesel-powered generators.
\r\nSource: https://www.dieselserviceandsuply.com/Diesel_Fuel_Consumption.aspx.
\r\n\r\n
Energy efficiency from primary fuel is roughly equal for\r\nelectricity from the national or regional grid and from onsite generators. The\r\ncost of primary fuels per kilowatt-hour generated is less for large power\r\nplants than for smaller diesel generators and grid electricity usually is less\r\nexpensive than electricity generated at shrimp farms.
Next Page of The Article: Energy Use in Aquaculture Pond Aeration Part 1/2
Ditulis oleh
Tim Minapoli
Kontributor
Pakar di bidang akuakultur dengan pengalaman lebih dari 15 tahun. Aktif berkontribusi dalam pengembangan industri perikanan Indonesia.